To add TrueAI to your account: Contact your TrueLook sales representative.
TrueAI provides insights and data about your jobsites using your TrueLook Camera. TrueAI can be viewed either live with AI Overlay, or compiled as charts and graphs on the TrueAI Dashboard.
AI Overlay
Activating AI Overlay
Select an AI-enabled camera from your Devices dashboard. AI-enabled cameras are marked with the ![]() AI icon.
AI icon.
Once on the camera view, click the Start AI Overlay button on the right. This will start a live stream of your camera to launch AI Overlay.
Your top-left corner now shows a count of each object AI sees.
![]()
- People: Any on-foot pedestrians.
- Buses: Specifically for buses, or any similar multi-person vehicle (e.g. trains)*
- Cars: Any vehicles that are smaller than the truck-sized vehicles.*
- Bikes: Any two-wheeled vehicles (i.e. bicycles or motorcycles.)*
- Trucks: Any larger-sized trucks (e.g. semi, delivery, dump, tanker, etc..)*
- Vehicles: Total of all vehicles.
* Newer cameras can categorize the type of vehicle.
TrueAI Dashboard
Accessing the TrueAI Dashboard
The TrueAI Dashboard can be accessed from two places, the device dashboard and the camera view.
1) From Device Dashboard: Click the ![]() AI icon on the camera of your choice.
AI icon on the camera of your choice.
2) While viewing a camera: Click the Live menu at the top of the screen and select TrueAI Dashboard.
TrueAI Dashboard Details
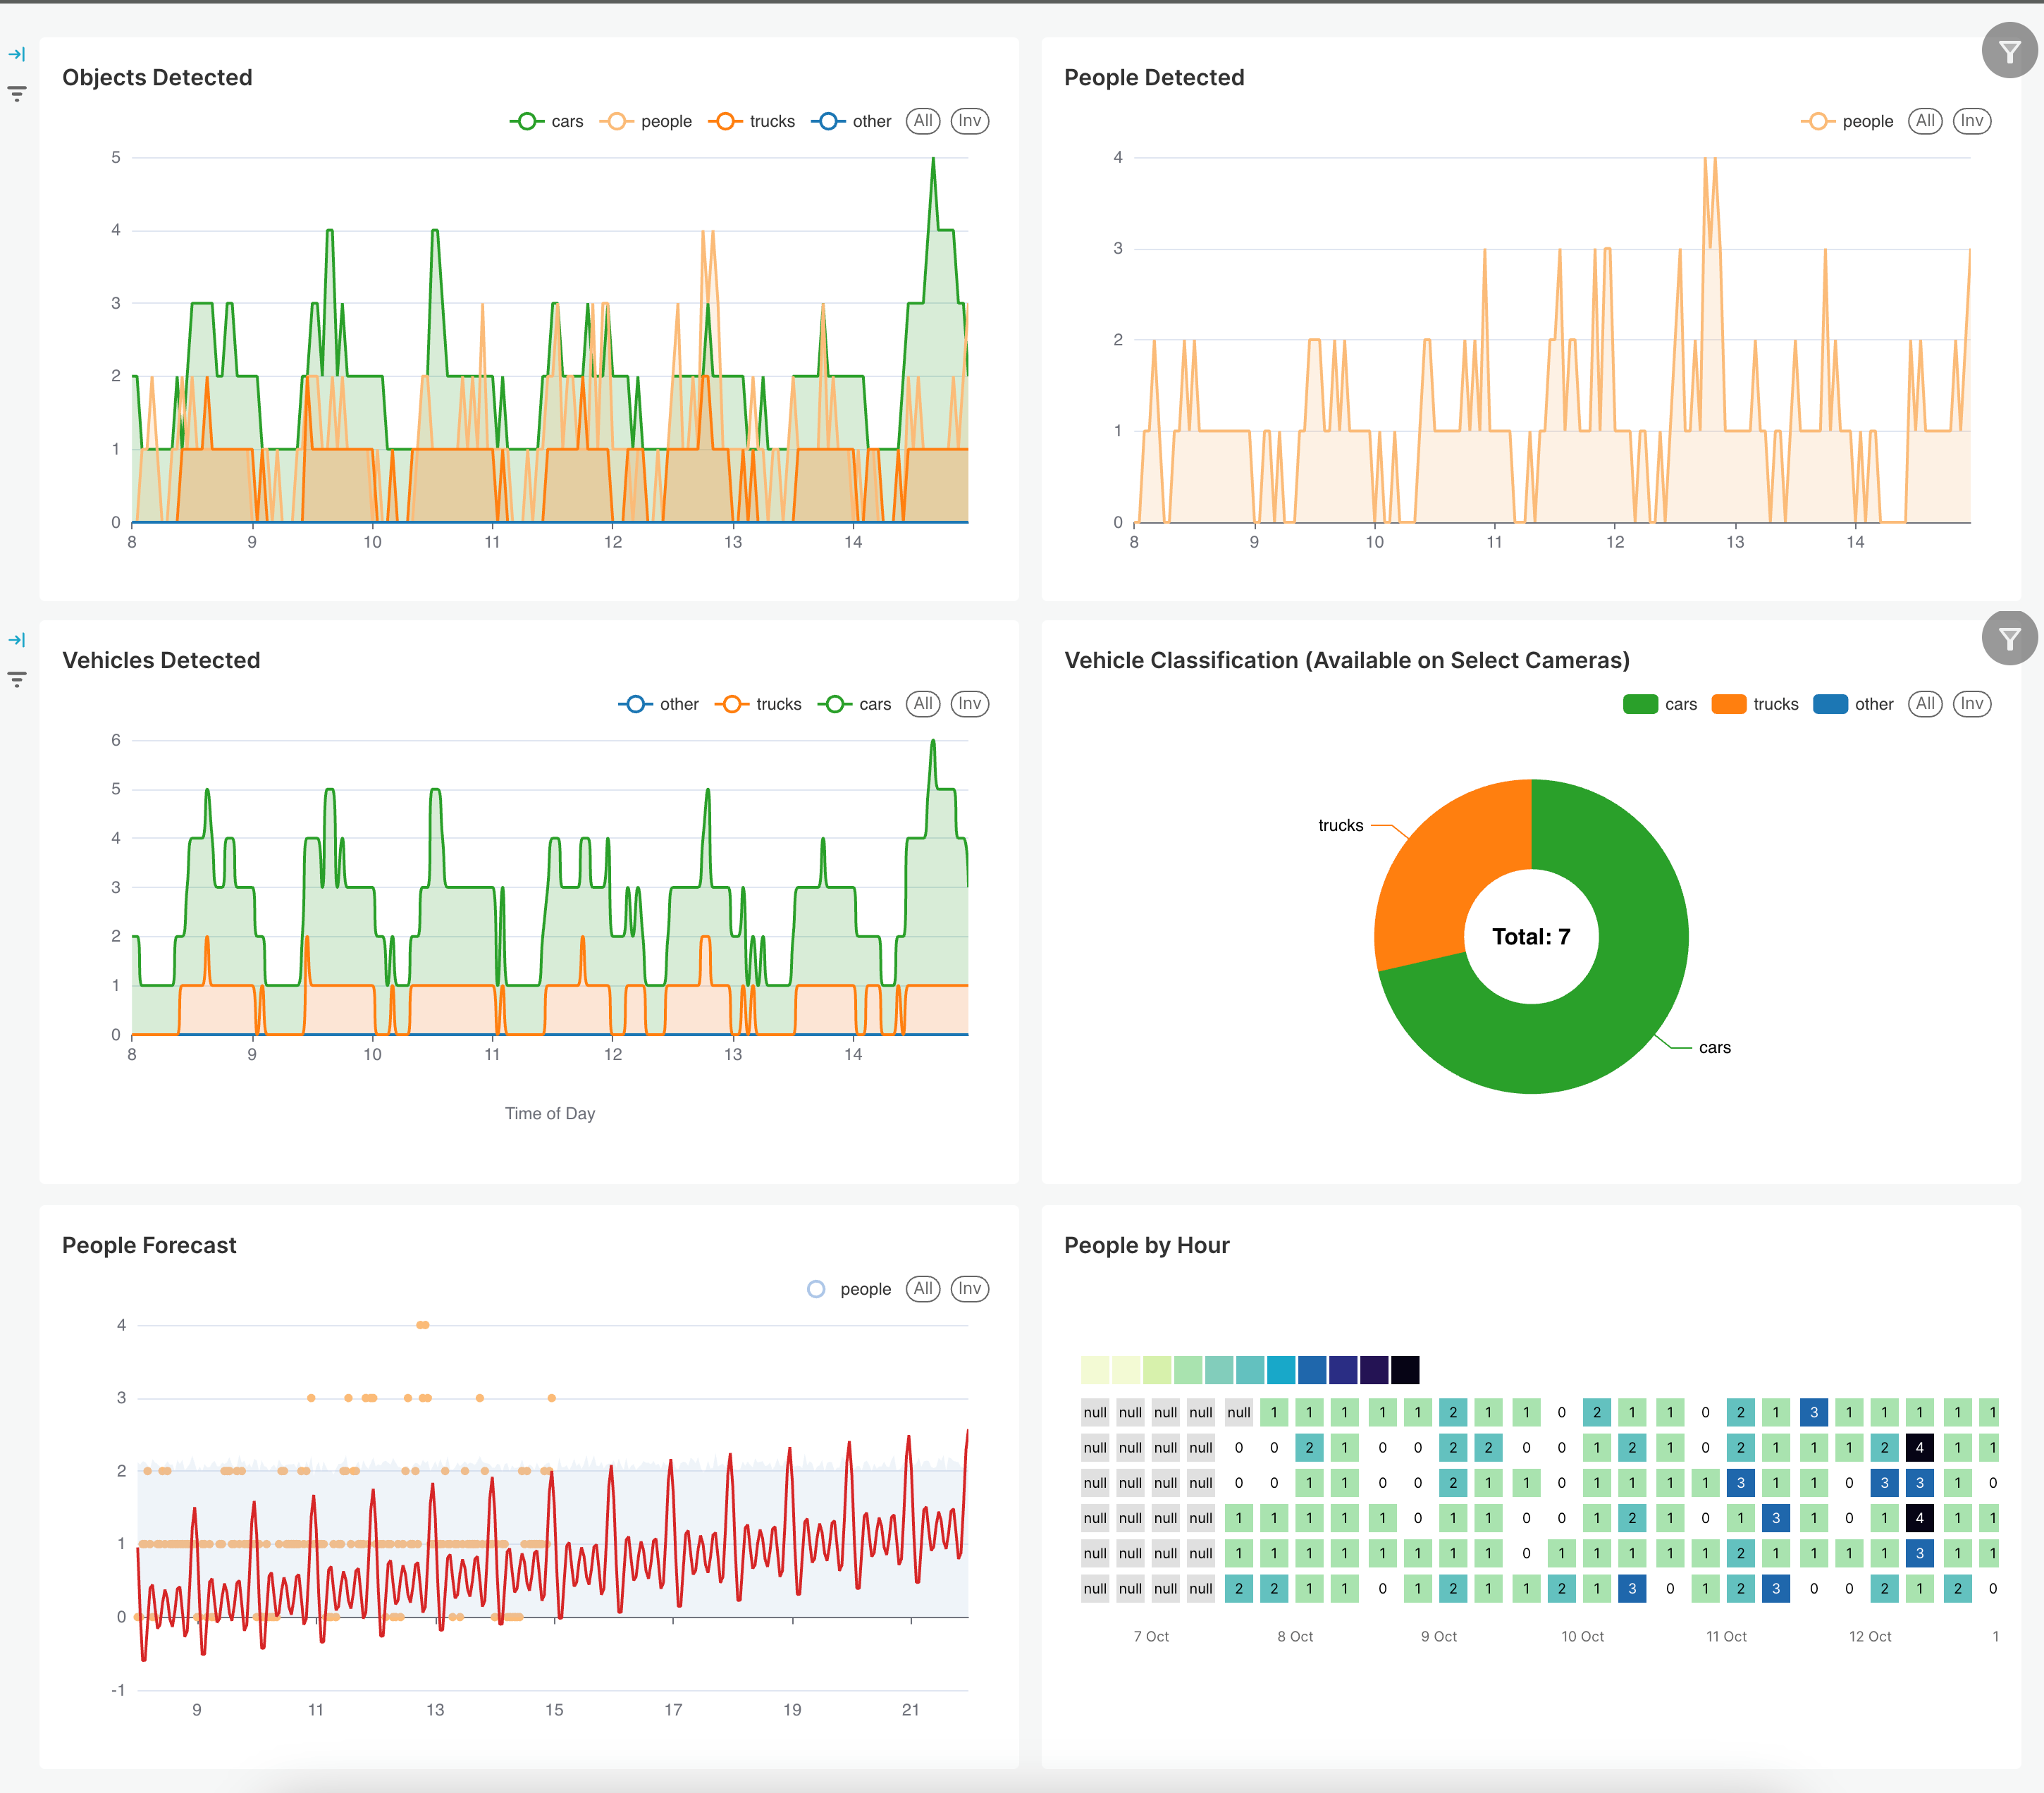
The TrueAI Dashboard compiles and organizes jobsite activity into charts and graphs.

- Objects Detected: The total number of objects detected each day (pedestrians + vehicles).
- People Detected: The number of pedestrians detected each day.
- Vehicles Detected: The number of vehicles detected each day. Newer cameras will categorize vehicle types (cars, trucks, bikes, etc.).
- Vehicle Types: The different vehicles seen over a specified date range.
- People Forecast: A trend chart of people detected each day and an estimate for how many people will likely be detected each day.
- People by Hour: Heatmap for when people were on the jobsite each hour each day. The colors represent how many people were there each hour.
Adjusting Time-Frames for the TrueAI Dashboard
Select chart and graph date ranges by clicking the arrow on the left of the charts. Use the options to select the time range of data included in the charts and graphs.
