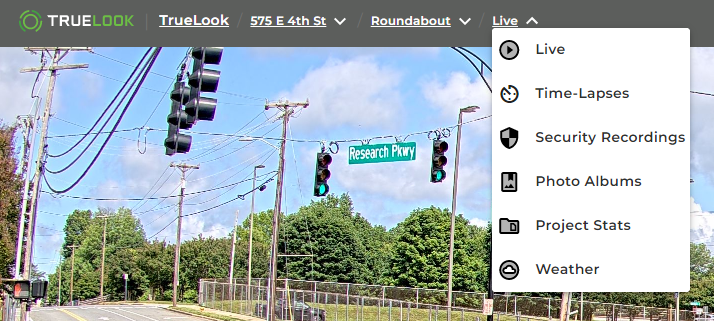
You can access Weather and Project Stats from the breadcrumb menu. These provide insights into current and historical weather as well as user analytics.
Current Weather
Once you have selected a camera to view, you can then select the Weather page. There is one Weather page for every project no matter how many cameras are active for each project
The Current Weather tab shows the following:
- Current Weather
- Radar
- Hourly Forecast
- Conditions
- 14 Day Forecast
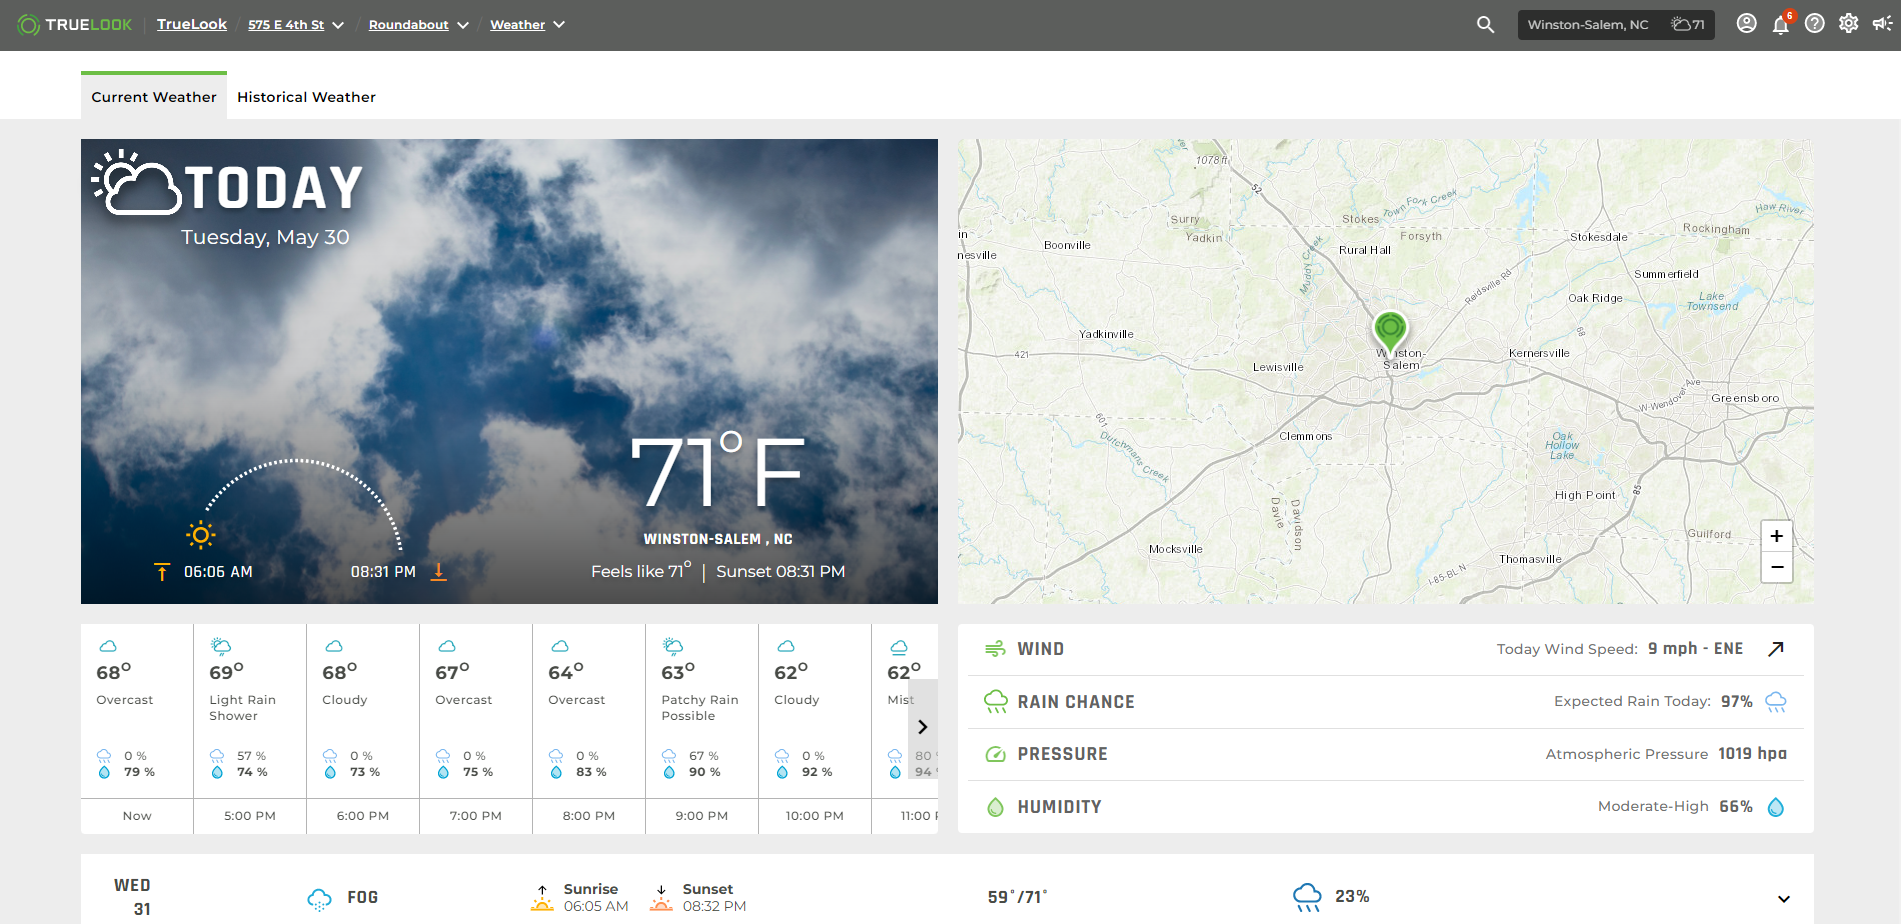
Radar
You can use the Radar to gain more insights into the weather conditions for your project’s area.
Hourly Forecast
You can scroll through the Hourly Forecast to see the conditions for the project’s location on an hour-by-hour basis.
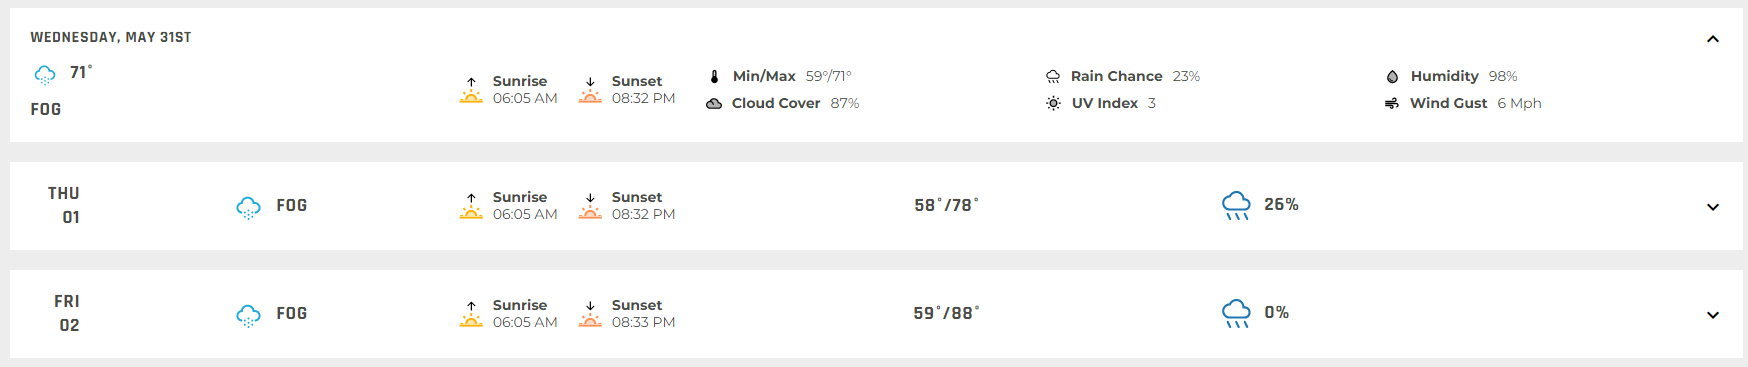
14 Day Forecast
You can expand the 14 Day Forecast card to see the forecast for a given day.
Severe Weather Alerts
If your project’s location has a severe weather alert, you will see that at the top of the Hourly Forecast section.
Historical Weather
Each TrueLook project records local weather conditions based on the project zip code. To access this information, you can click on the Weather History tab from the Weather page.
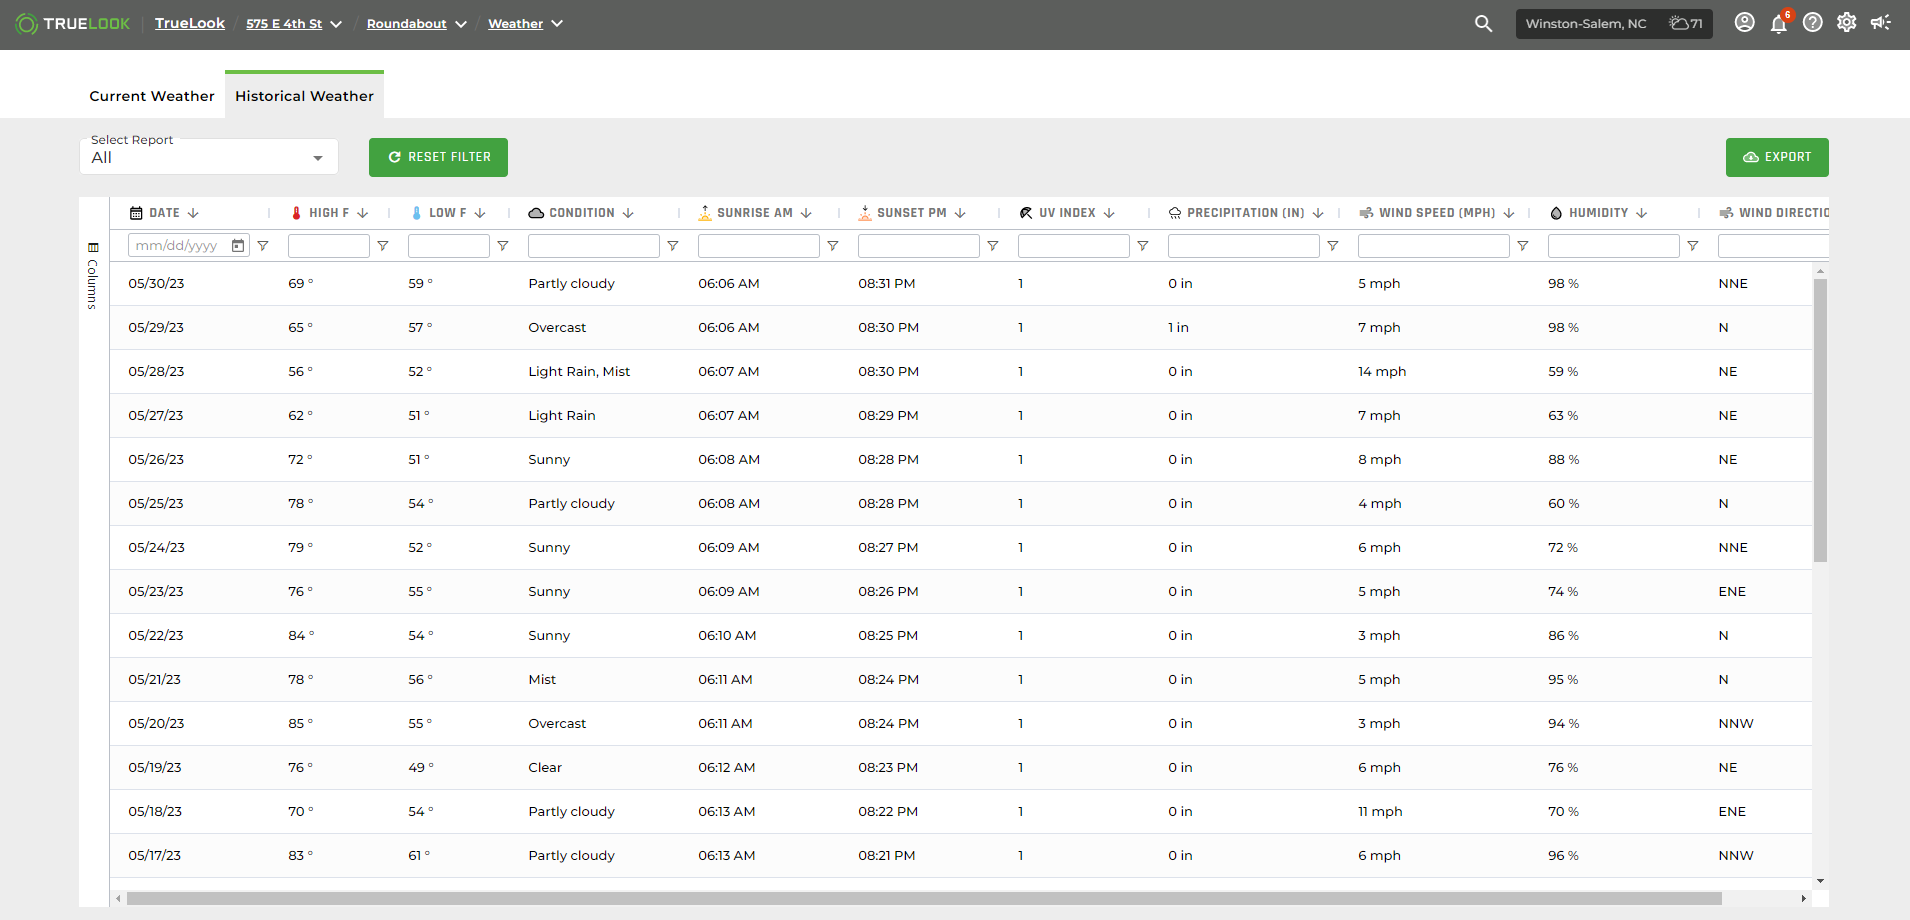
Reports
There are 7 reports that are available. The default time period for the reports is the last 30 days. You can look back to see up to 3 years’ worth of historical weather information for your project (if applicable).
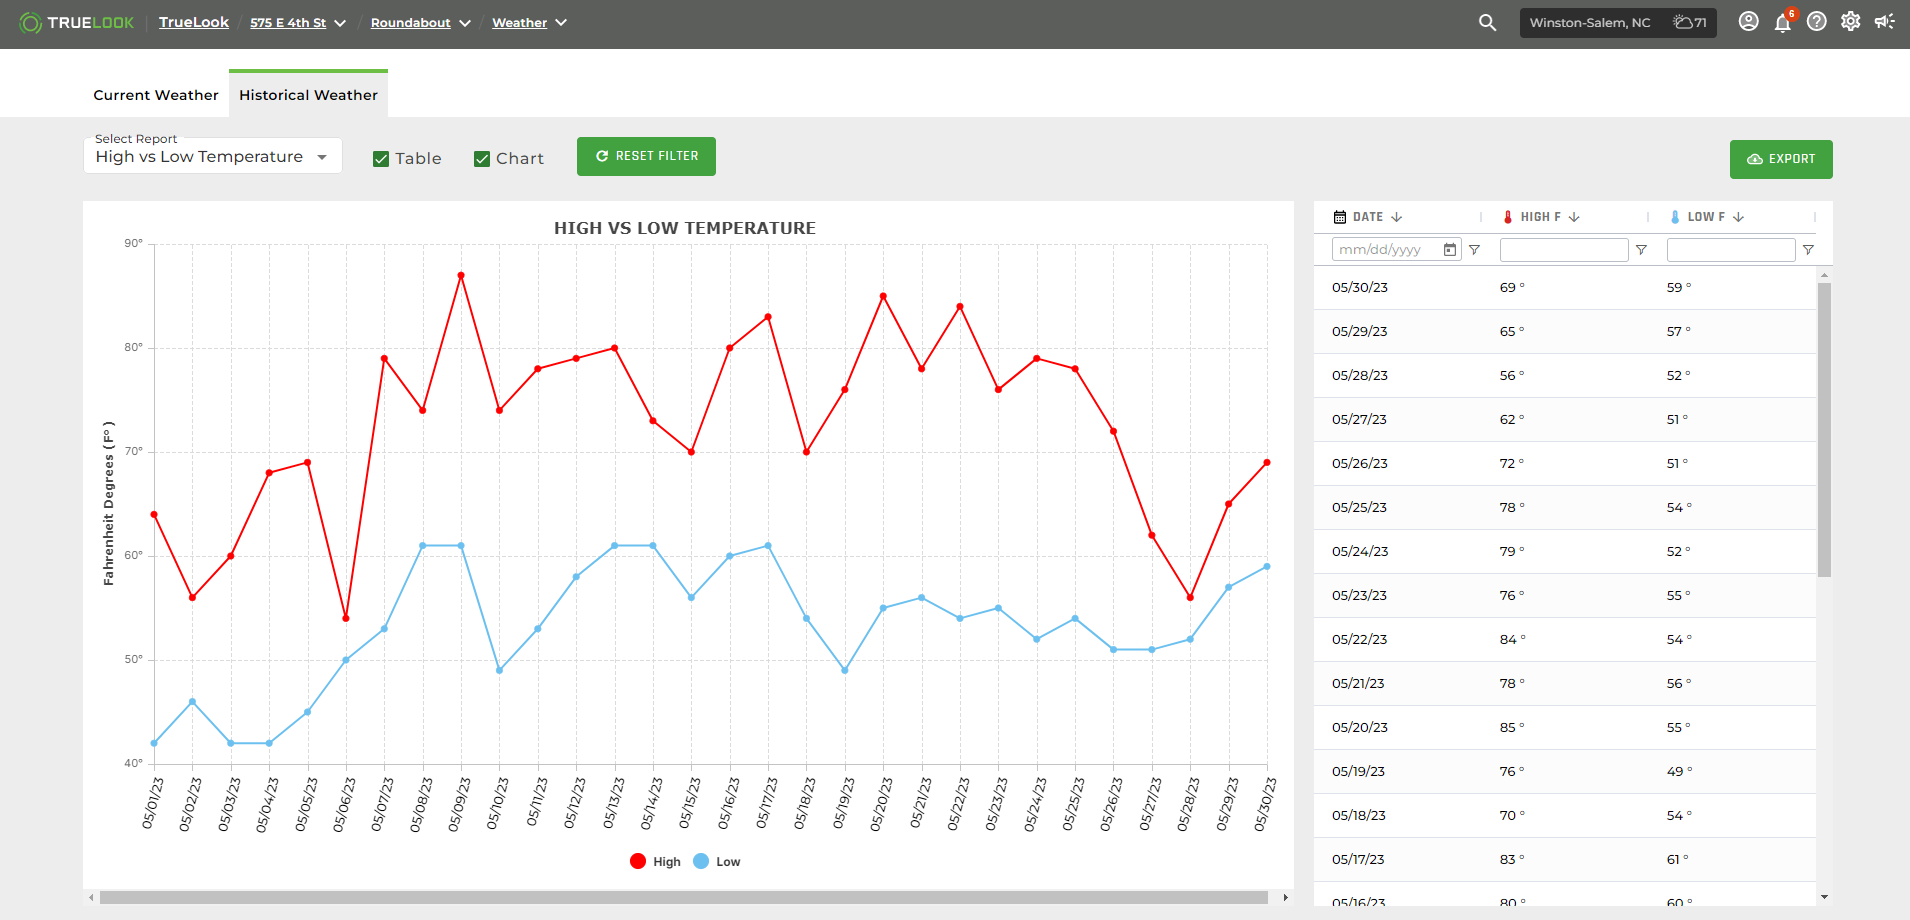
There are many different reports available. The image below shows “High vs Low Temperature” as an example:
| Report Name | Description | |
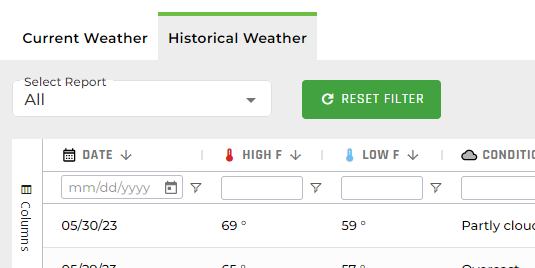
| 1 | All | By default, the “All” report is shown |
| 2 | High vs Low Temperature | Shows trends for High and Low temperatures for your project’s location. |
| 3 | Precipitation | Shows Rainfall trends for your project’s location. |
| 4 | Humidity | Shows Humidity trends for your project’s location. |
| 5 | UV Index | Shows UV Index trends for your project’s location. |
| 6 | Wind Speed | Shows Wind Speed trends for your project’s location. |
| 7 | Sunrise vs Sunset | Shows Sunrise and Sunset times for your project’s location. |
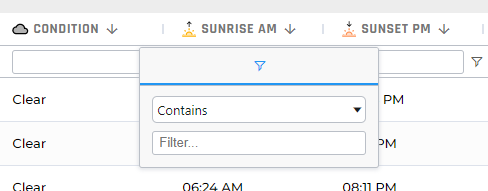
Filtering
You can filter the data using the column filtering under each column header.
You can type in a keyword or click the funnel icon to expand more advanced filtering options.
Column Sidebar
You can add or remove columns to only display those data elements you wish to analyze by clicking the Columns Sidebar.
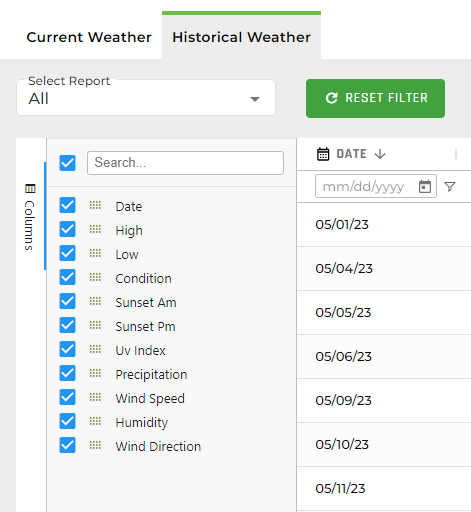
Chart Controls
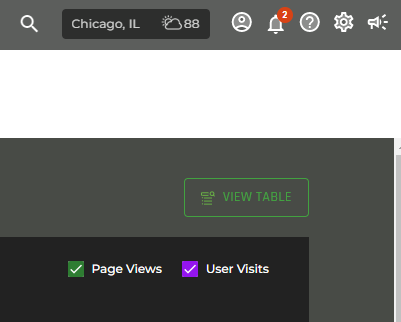
By default, both the chart and table are displayed on reports except the “All” report. You can turn on or turn off a chart or table using the chart control checkboxes.
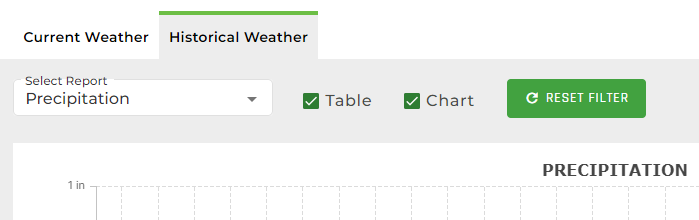
Reset Filter
You can reset the table and chart back to its default state by using the Reset Filter button.
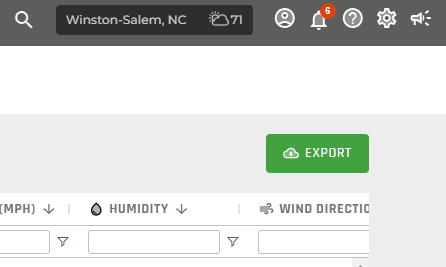
Export
You can export the chart and table for any report by clicking the Export button.
Weather Settings
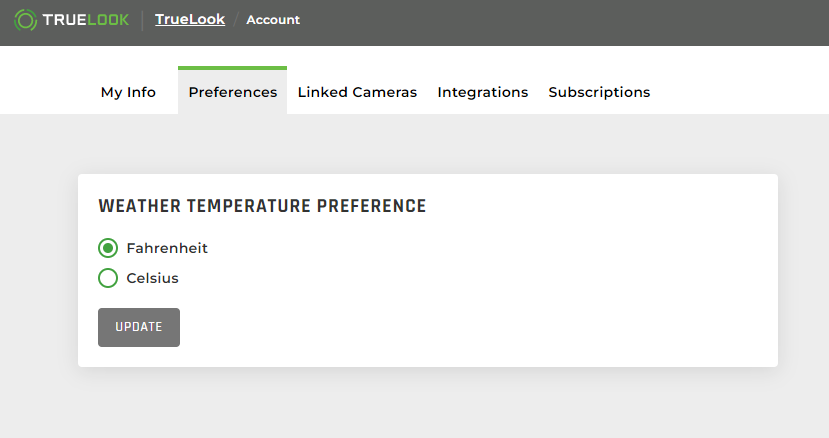
You can set the Preferred Weather Format to either Fahrenheit or Celsius.
This can be done via your Account → Preferences.
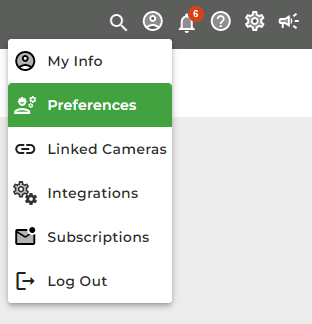
You can then toggle between the two options and click “update” to save changes.
Project Details
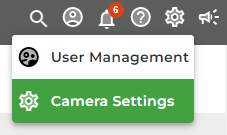
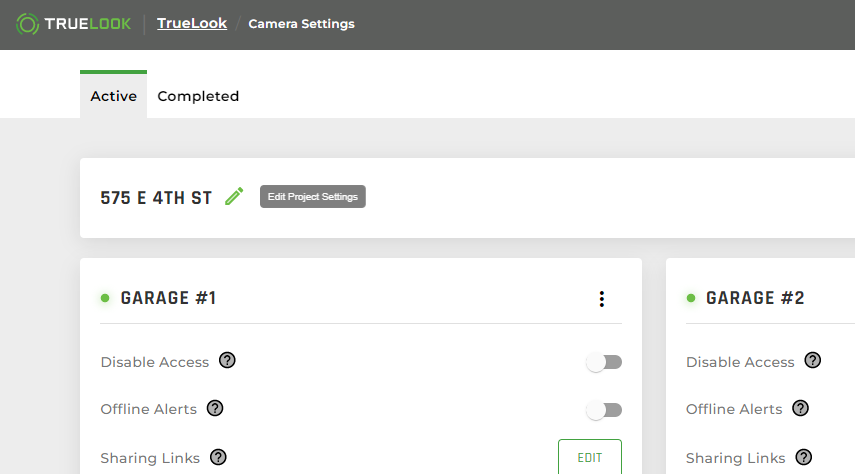
A Customer Admin or Project Admin can update the Project Details for their given project. First, navigate to Camera Settings.
From Camera Settings, click the Edit pencil.
Edit Project Details
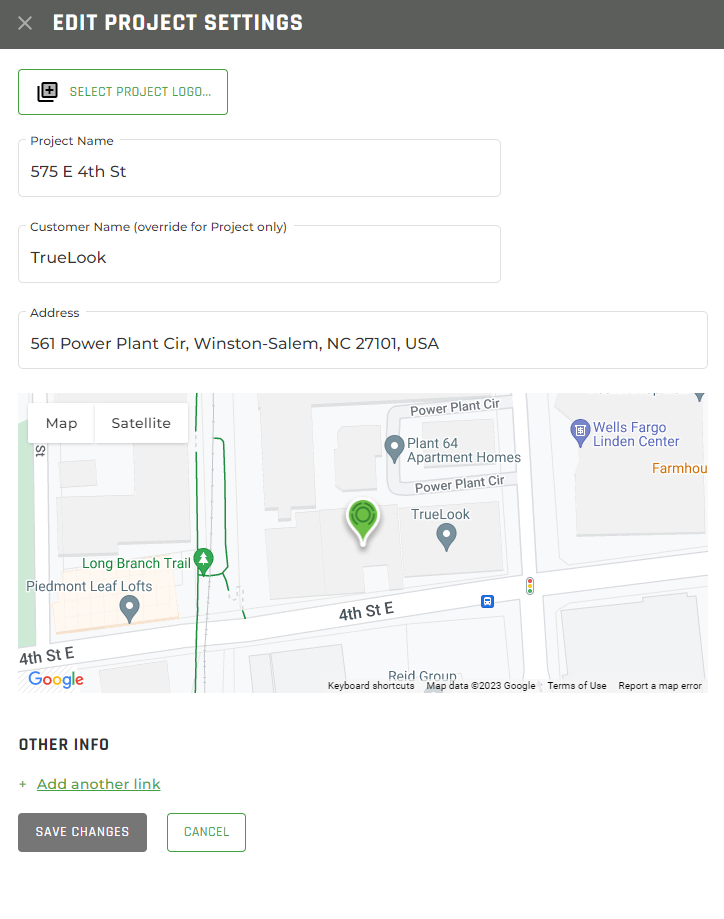
From here you can change the following:
- Select (upload) a new project logo.
- Change the project name.
- Change the customer name (note: this is only different within the project and will not change the customer name for other projects or the account).
- Change the address for the project site.
- Add or change links for the project.
Project Stats
Each TrueLook project captures data on visitors who view the site. To access this information, admins can click on the Project Stats page from the breadcrumb menu.
The data displays all days the camera has been active up to the previous day. Current-day statistics are not shown.
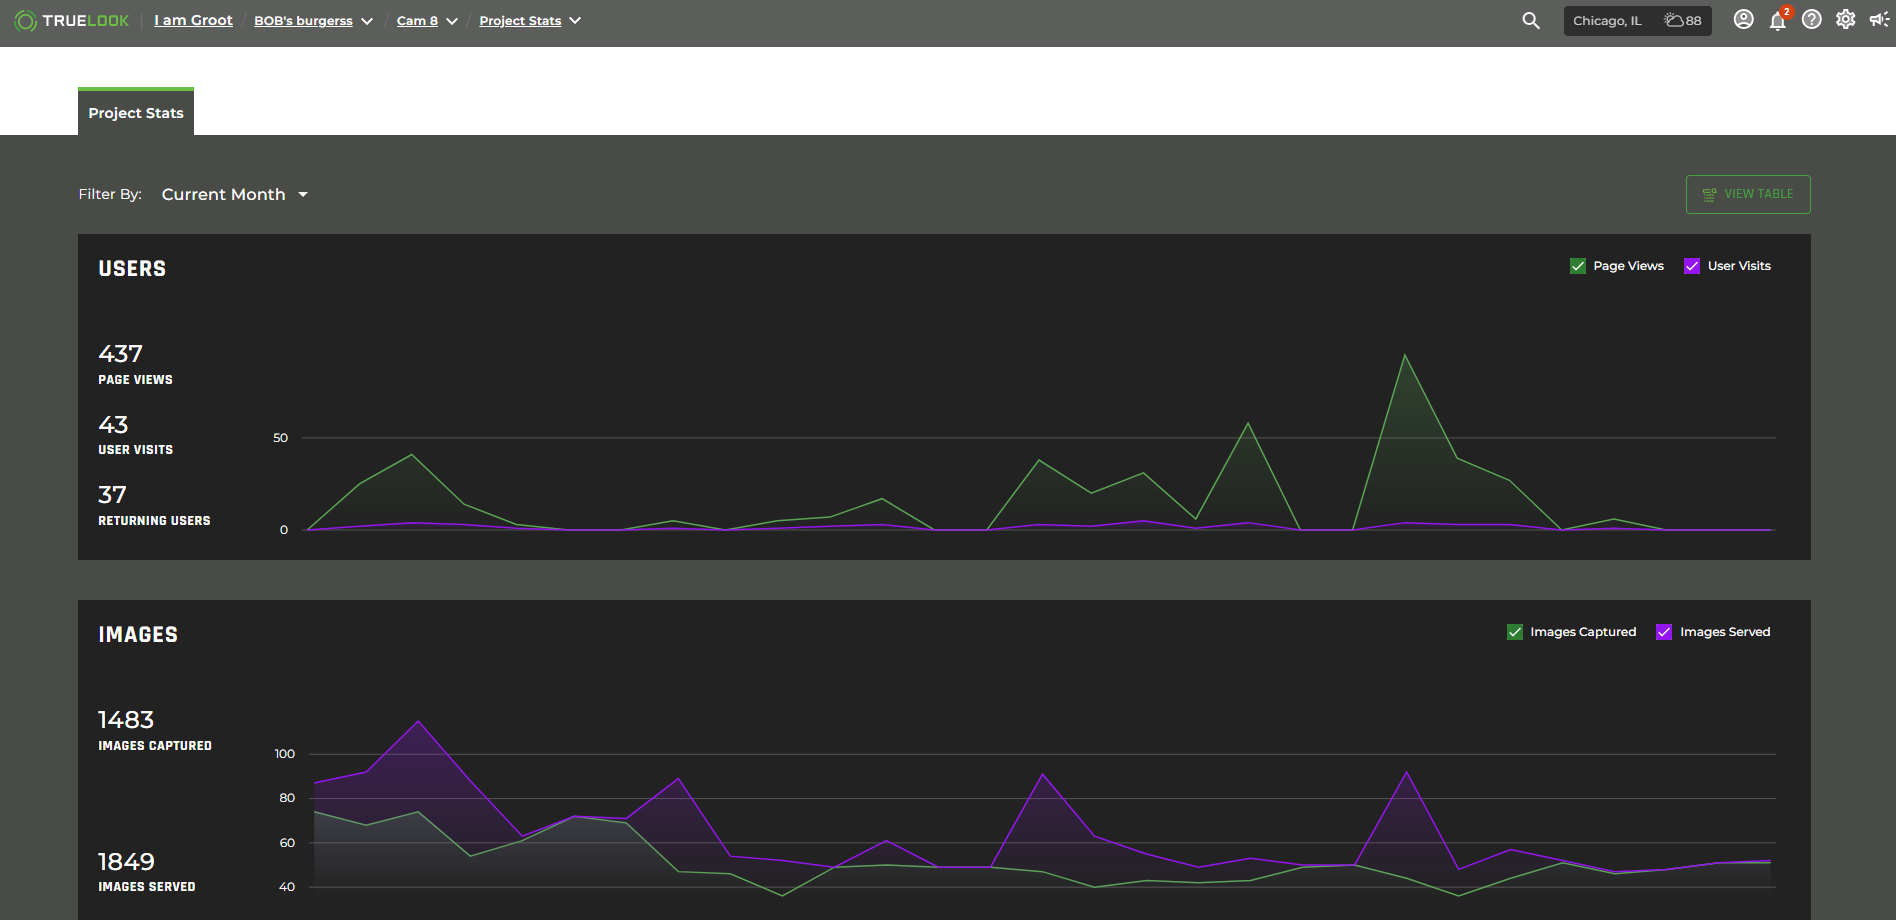
All Project Stats can also be viewed in a table format by clicking on the “View Table” button.